Revenue Per Rep Is Lying To You

By AJ Mahar
Sales Performance Advisor @ Sellfire
By AJ Mahar
Sales Performance Advisor @ Sellfire
A company can double its revenue while every rep on the floor gets worse at the job. The board only ever sees the first number.
The conventional read on a growing sales floor is simple: if total revenue is up, the team is working. Hire more reps, revenue climbs faster, everyone's happy. That read is exactly backwards, and it's the reason boards keep approving headcount plans that are quietly making the business worse. Total revenue is an aggregate. It goes up every time you add a seat, even if the seat is less productive than the ones already on the floor, and past a certain scale, that's exactly what's happening. The floor isn't getting better. It's getting bigger, and bigger is being mistaken for better. It is one of the quieter reasons why scaling breaks sales.
The Metric That Hides the Rot: Total Revenue
Logic-Based Selling, refined across hundreds of millions of cold calls, including with outbound teams at brands like FieldPulse and FreshBooks, treats gut-instinct management as a symptom of small scale, not a sign of skill. At 10 reps, a founder can watch the whole floor and know, by feel, who's carrying the month. At 50, that same instinct is running on a sample size it can no longer see. This is the exact failure mode the Five Pillars name directly: without a rigorous, data-driven decision process, an organization cannot achieve continuous improvement as it scales; it can only get louder about the same underlying problems. Total revenue is the ultimate gut-instinct metric dressed up as data. It's real, it's on the P&L, and it tells you almost nothing about whether the floor itself is healthy, because it never separates the reps who are earning their keep from the reps who are still learning the job.
Here's the math that makes this concrete. A floor of 20 reps averaging $10,000 a month each produces $200,000. Hire 10 more reps at half that productivity while they ramp, and monthly revenue climbs to $250,000, a headline win. But average revenue per rep just fell from $10,000 to $8,333, a 17% decline dressed up as 25% growth. Nobody in the board meeting notices, because nobody's asking the question that would surface it.
The Rev/Rep Cohort Analysis: The Number That Tells the Truth
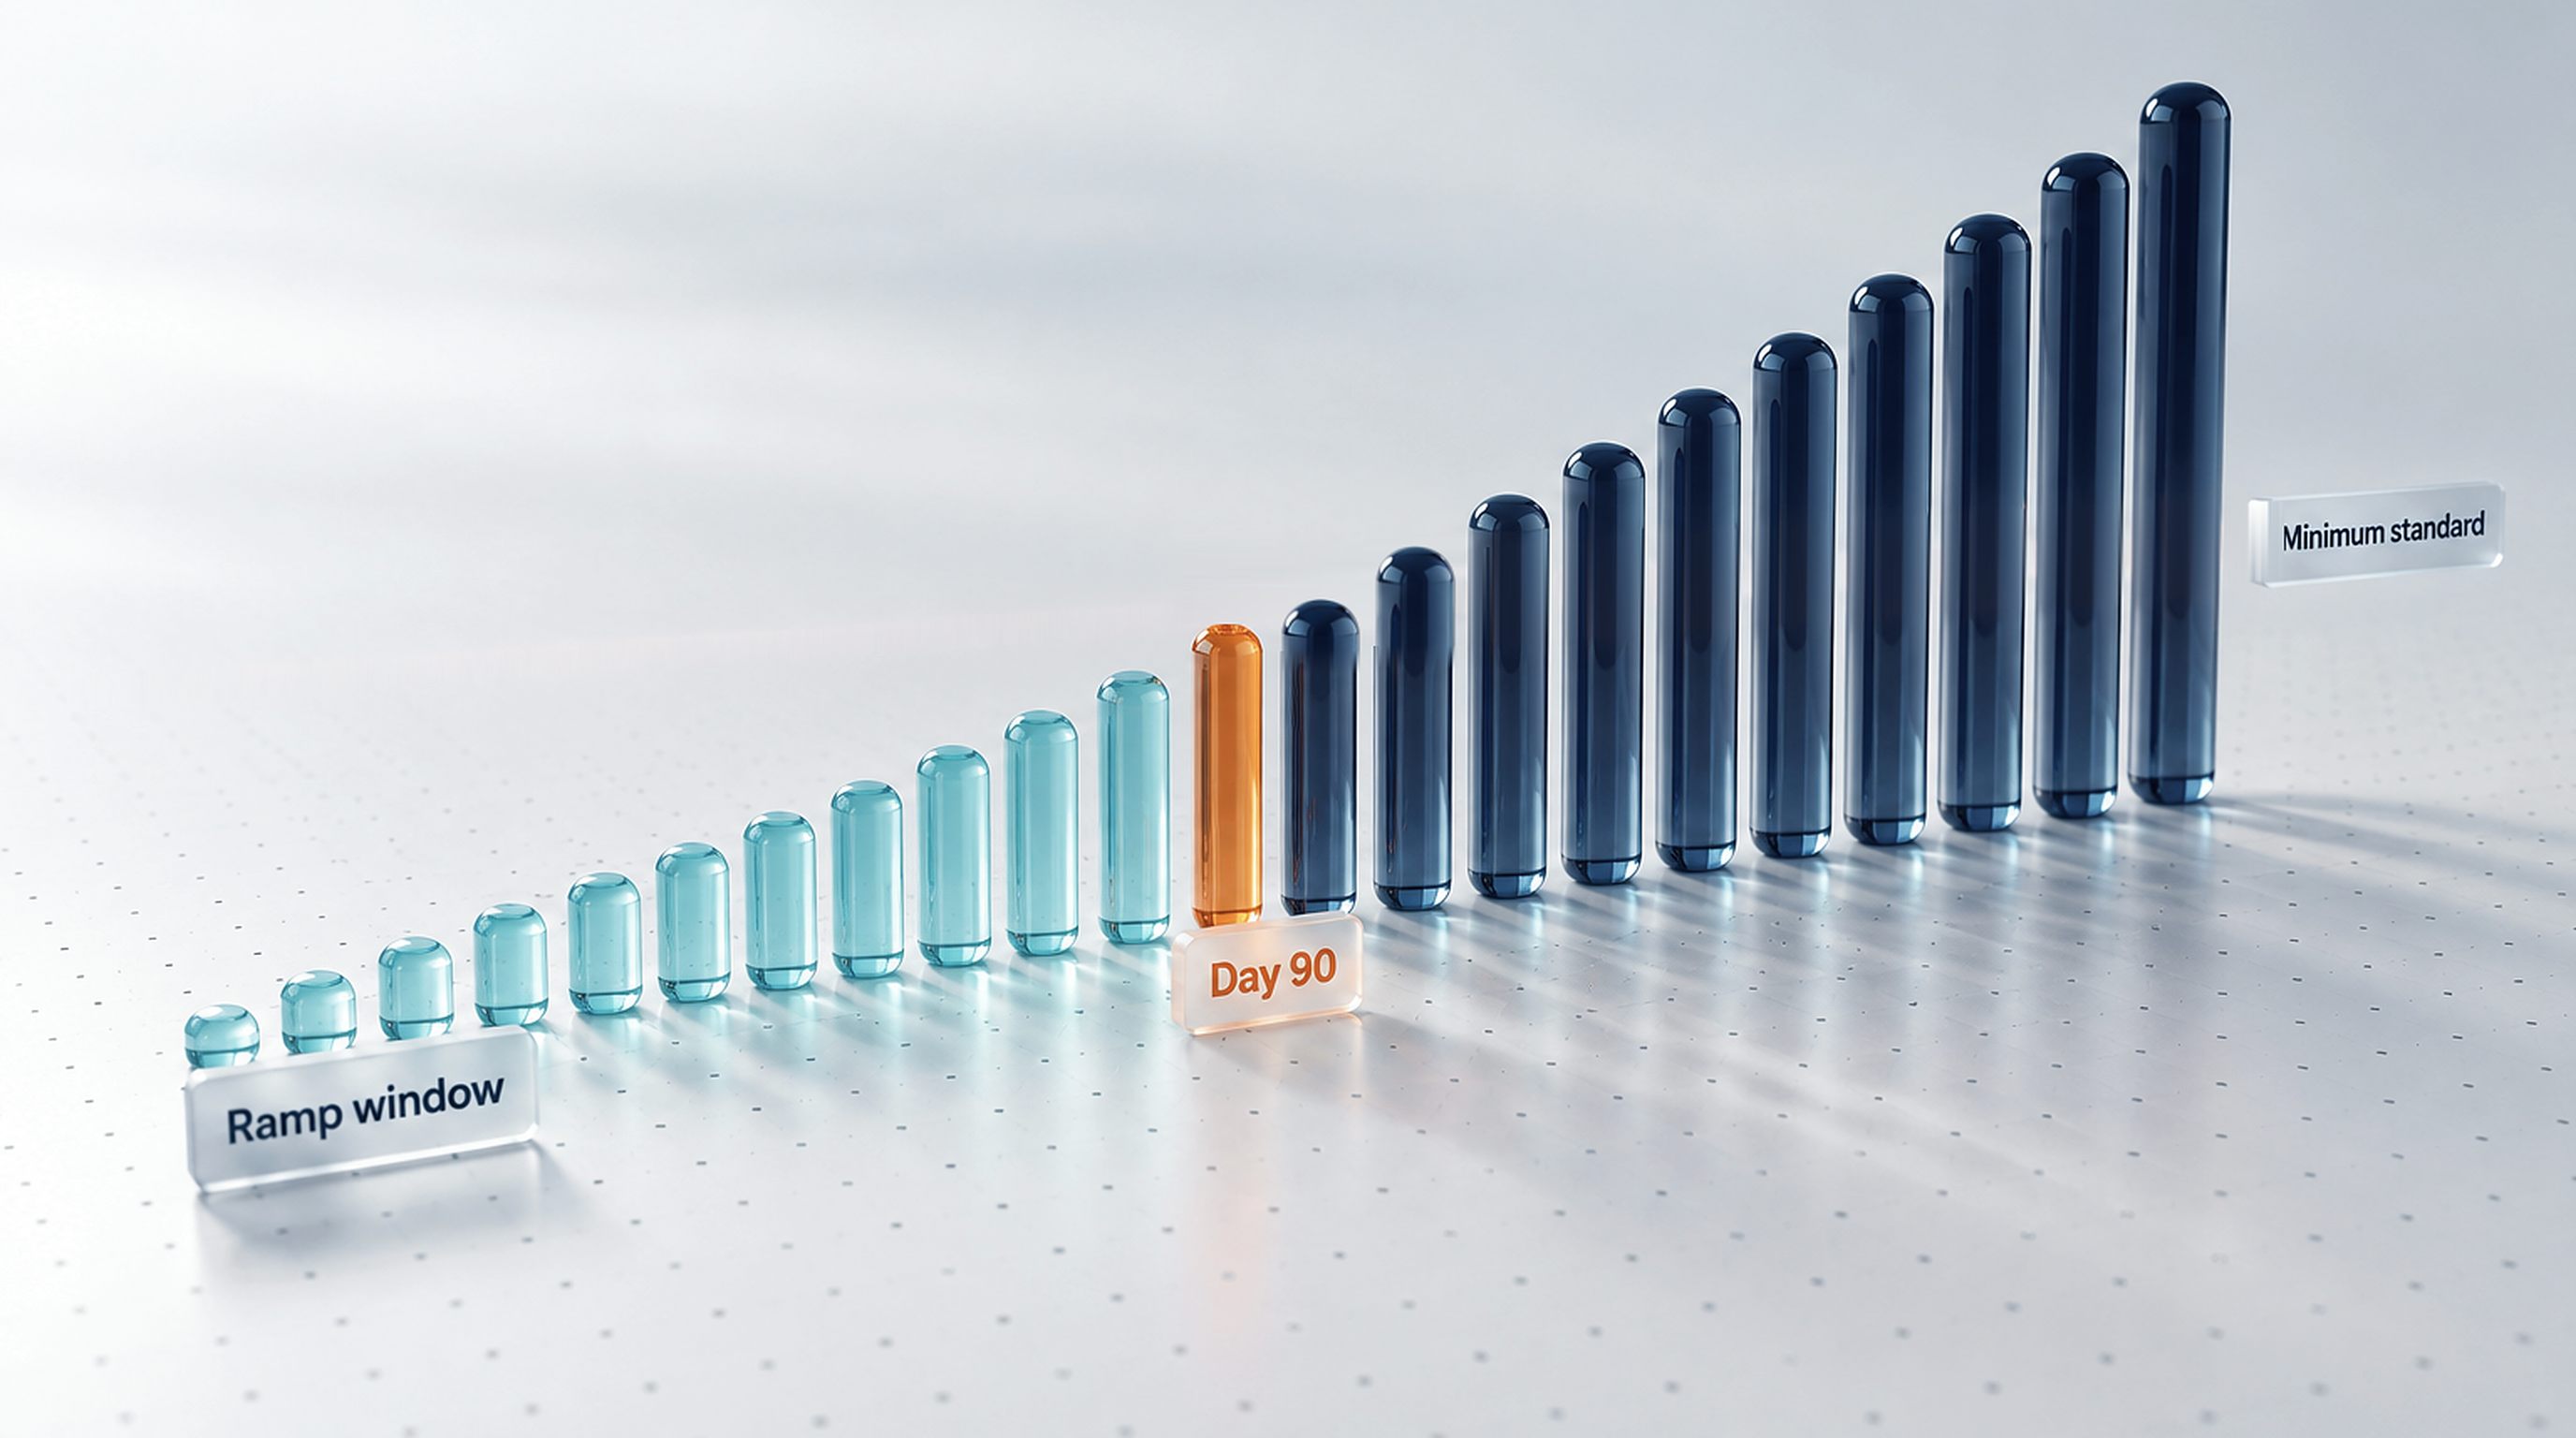
The fix isn't a better headline number; it's a different number entirely. A rev/rep cohort analysis breaks revenue per rep out by tenure instead of blending it into one floor-wide average, and it answers the questions that actually matter: How productive are reps on average at each stage of development? How many months does it take them to ramp to minimum productivity? When do they become maximally productive? Who are your most productive teams, and what are their managers doing to coach reps to that level? And where does retention actually need to be defended?
Run that analysis and the picture in the example above stops being mysterious. It isn't that the 20 tenured reps got worse. It's that 10 new reps entered the blended average before they'd ramped, and a floor-wide number can't tell the difference between "declining" and "diluted." Those are two entirely different problems that call for two entirely different responses, and a single top-line revenue figure will never let you tell them apart.
Why This Happens: Cohort Composition, Not Team Decline
This is a cohort-composition effect, not a productivity crisis, and the distinction matters because they demand opposite responses. If reps aren't hitting minimum performance standards within their first 90 days, they probably won't, which means every hiring class carries a predictable number of reps who will wash out, and a predictable ramp period for the ones who stay. The floor's blended revenue per rep will always look worse in the months right after a hiring push, because the math is being dragged down by reps who are supposed to be unproductive right now. That's not decline. That's the plan working as designed, and 0-90 day attrition in that cohort matters far less than what happens to attrition rates among your tenured reps, the ones who've already proven they can hit the number.
The trap is reacting to the blended average as if it were a real signal. A founder who sees revenue per rep drop after a hiring class and panics (freezing headcount, second-guessing the comp plan, pulling coaching attention toward the newest hires instead of the tenured reps who are actually driving the number) is optimizing against noise. The cohort analysis exists precisely to keep leadership from managing the floor by an illusion.
Not All Revenue Is Equal Either
There's a second blind spot stacked on top of the first: even within a single, well-ramped cohort, a dollar of revenue isn't worth what the P&L says it's worth. Logic-Based Selling calls this revenue value: the practice of weighting each sale by its actual lifetime value to the company rather than treating every dollar as interchangeable. A one-time setup fee, a month-to-month contract, and a prepaid annual deal to a high-retention vertical can all show up as the same "revenue" on a rep's scoreboard while representing wildly different long-term value. A rep who looks like a top performer on raw revenue can be quietly generating the least valuable kind of it. Layer revenue value on top of a cohort analysis and you get the real picture: which reps, at which tenure, are producing revenue the company actually wants more of.
What the Real Number Should Change
None of this is actionable if it stays a one-time analysis. The reason most floors default to the blended headline number isn't that leadership doesn't know better; it's that nobody's handing managers the cohort-level answer without them having to build it themselves. The floors that get this right have moved the analysis out of a spreadsheet a manager builds once a quarter and into something the org can see continuously, which is also what makes it possible to actually act on: managers coaching the reps whose tenure says they should be closer to full productivity than they are, instead of splitting attention evenly across a floor where half the reps aren't supposed to be productive yet. Revenue per rep isn't a vanity metric because it's wrong. It's a vanity metric because almost nobody looks at it broken out by the one variable (tenure) that would make it tell the truth. Read it by cohort, and it stops lying to you.
This is the same discipline behind our complete guide to Logic-Based Selling: don't manage a floor by feel once it's too big to watch by feel. It's also the blind spot behind why most sales floors plateau: leadership keeps reading a floor-wide average instead of the number that's actually moving underneath it.
That is the operating model, and Sellfire is where it runs. Revenue per rep broken out by tenure cohort is on the screen by default, so nobody builds the spreadsheet and nobody manages by the blended average. Butch Hodson, Sellfire's Head of Sales Performance and the leader who proved Logic-Based Selling at scale, runs that model for customers, and the 297% revenue-per-rep results those customers see are measured the same way: rep by rep, cohort by cohort.
For the deepest treatment of the methodology, we'll send you a free copy of *Sales Lab Scripting*, the book Butch Hodson and AJ Mahar wrote documenting the full playbook. Or, if you want to see where your own floor's numbers actually stand, find out how fast you can grow.
Frequently Asked Questions